May. 5, 2020
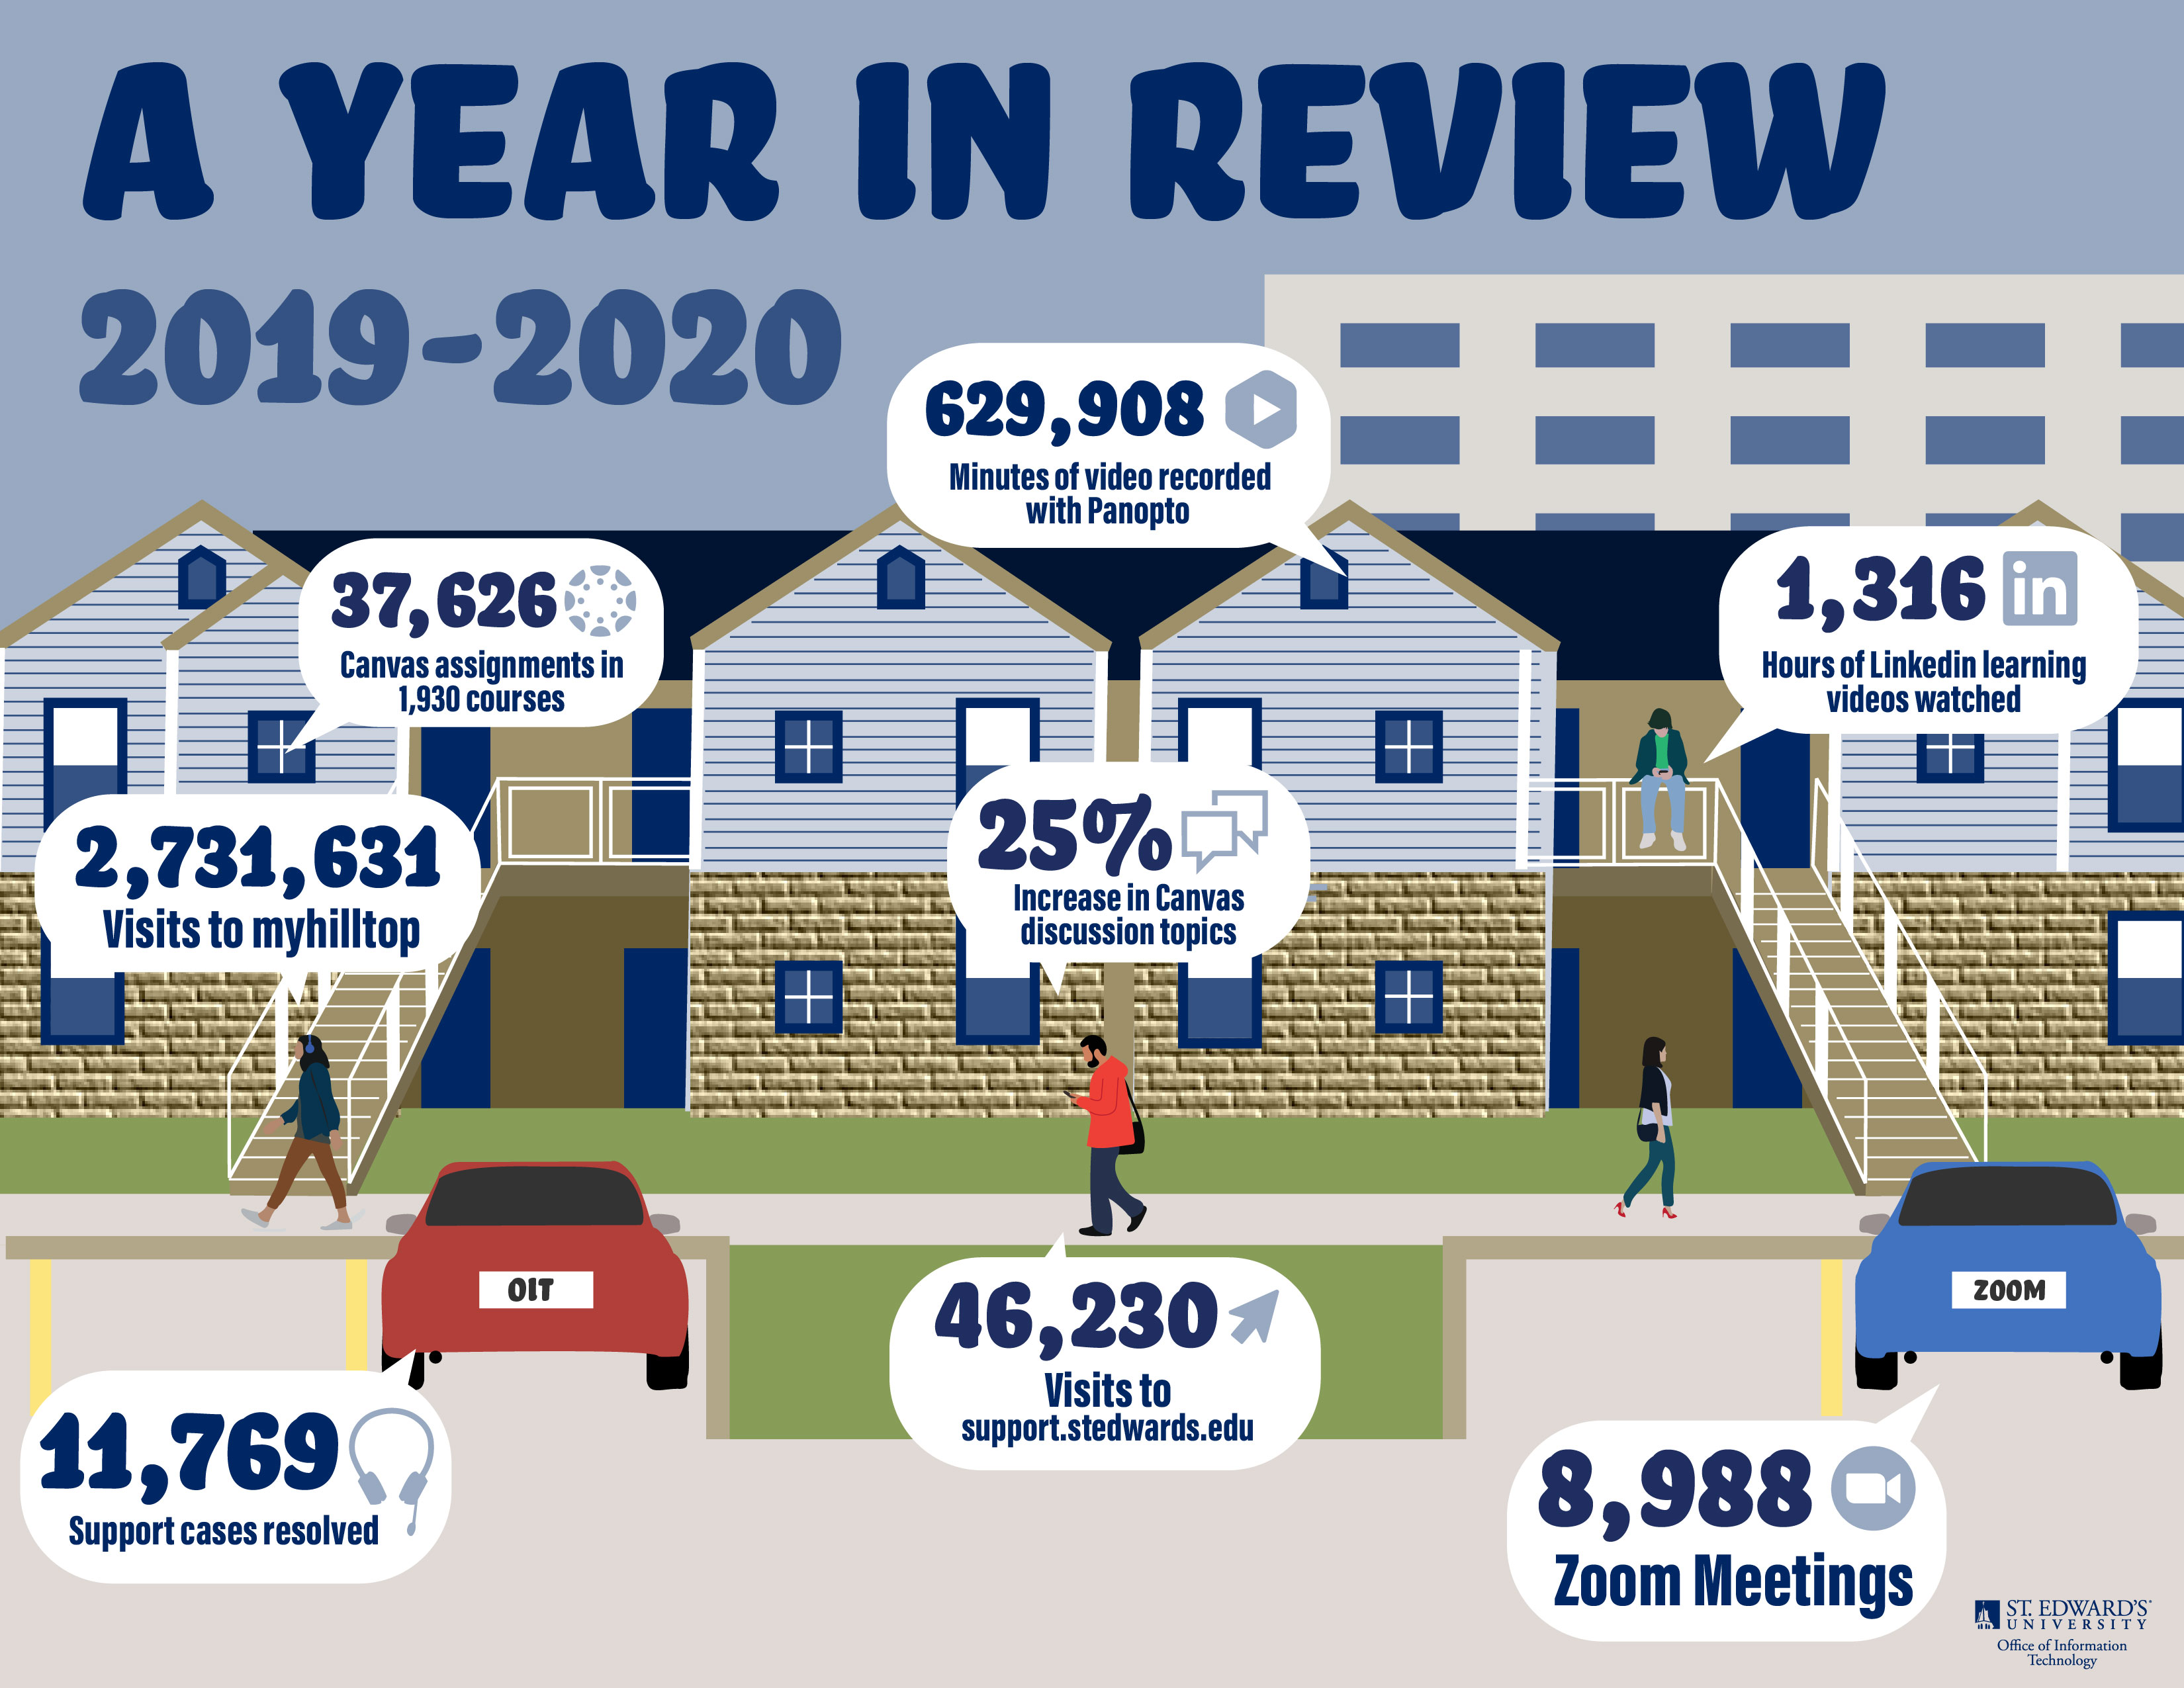
Well, that was certainly a time. The spread of the new coronavirus threw a curveball at the 2019-2020 academic year. And the numbers tell the story.
The university’s sudden switch to online instruction and remote work in response to the spread of the new coronavirus had a wide-ranging effect on all aspects of our community. In OIT, we witnessed those effects personally as use of Canvas, Zoom and other remote learning tools skyrocketed.
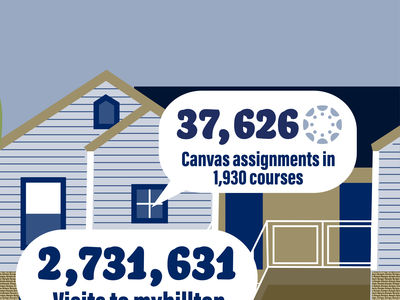
To help visualize the year, we crunched the numbers, looking at various stats and analytics for a wide range of tools that kept St. Edward’s running — on and off the hilltop. (We also crunched the numbers for myHilltop — all 2,731,631 visits this fall and spring.)
Note: Unless otherwise noted, data reflects usage between Aug. 26, 2019, and April 24, 2020.
The Rise of the Video Call
You know, of course, that you spent a lot of this year on video calls — particularly this spring. But do you know just how many video calls?
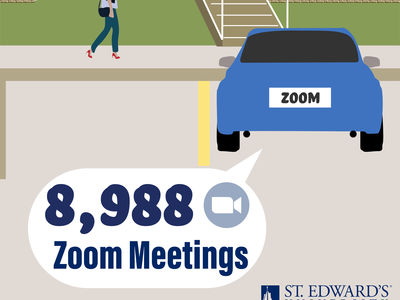
Over the course of the academic year, there were 8,988 Zoom calls at St. Edward’s. The majority of those calls happened in March and April.
“Faculty and students discovered that, even when they couldn’t be in a classroom together, they could maintain connection through live Zoom meetings,” said Rebecca Frost Davis, associate vice president for Digital Learning. “We learned new vocabulary like ‘Zoom bombing’ and ‘Zoom fatigue,’ and we all began an informal competition to see who could come up with the best virtual background.”
But we’re not just talking about Zoom. From October through the end of April, you made 9,232 Google Meet video calls. (More than 8,000 of those calls took place after February.)
Online Assignments, Online Lectures, Online Everything
What about coursework itself? It certainly looked a little different.
Across 1,930 Canvas courses, the fall and spring semesters had 37,626 online assignments.
Also of note, Canvas discussion topics jumped 25% between the fall and spring semester.
Similarly, use of Panopto for pre-recorded lectures and videos soared. St. Edward’s students and faculty watched an astounding 629,908 minutes of video in Panopto. And those who weren’t watching Panopto? They were taking in 1,316 hours of LinkedIn Learning content.
“Rather quickly, faculty learned alternative ways to deliver their course content, by recording lectures and referring students to existing resources in LinkedIn Learning,” said Brenda Adrian, associate director of Instructional Technology.
How (Often) Can We Help?
Two weeks to switch everything at the university to a remote setup was a challenge — for you and OIT support staff, too.
Our goal always is to provide students, faculty and staff with as many resources as possible.
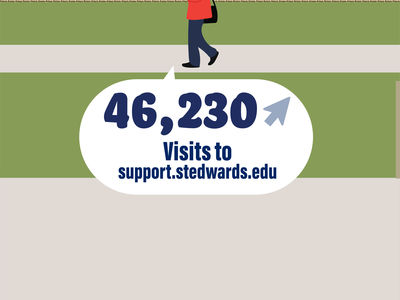
That’s why we have an online support center, stocked with articles and how-to guides. Hopefully, you found it helpful in one of the 46,230 visits to support.stedwards.edu this year. And if you didn’t find what you needed, we hope we were able to help in this year’s 11,769 (and counting) resolved support cases.
“Usually, when we measure OIT support, we look at how many people we helped on the phone, in person or in one of our campus spaces,” said Jason Arellano, manager of User Services. “This year, our priority shifted to serving that same community online, especially through our support center, support.stedwards.edu.”
It wasn’t easy, but you did it, adapting to an entirely new way of learning and working. And together, as a university, we made it a year we’re unlikely to forget.